Data Quality
We place a premium on Data Quality as this is essential to build trust and confidence in your organisation's Data. Data stewards are expected to understand their Data and be able to define the rules that should be implemented to control the quality.
Dashboards
We believe that Data Quality is something that must be a live feed and must be monitored continuously, so that all issues are resolved at source as soon as possible. This requires all business functions to buy into the vision and ensure their Data is always of great quality for the good of the organisation.
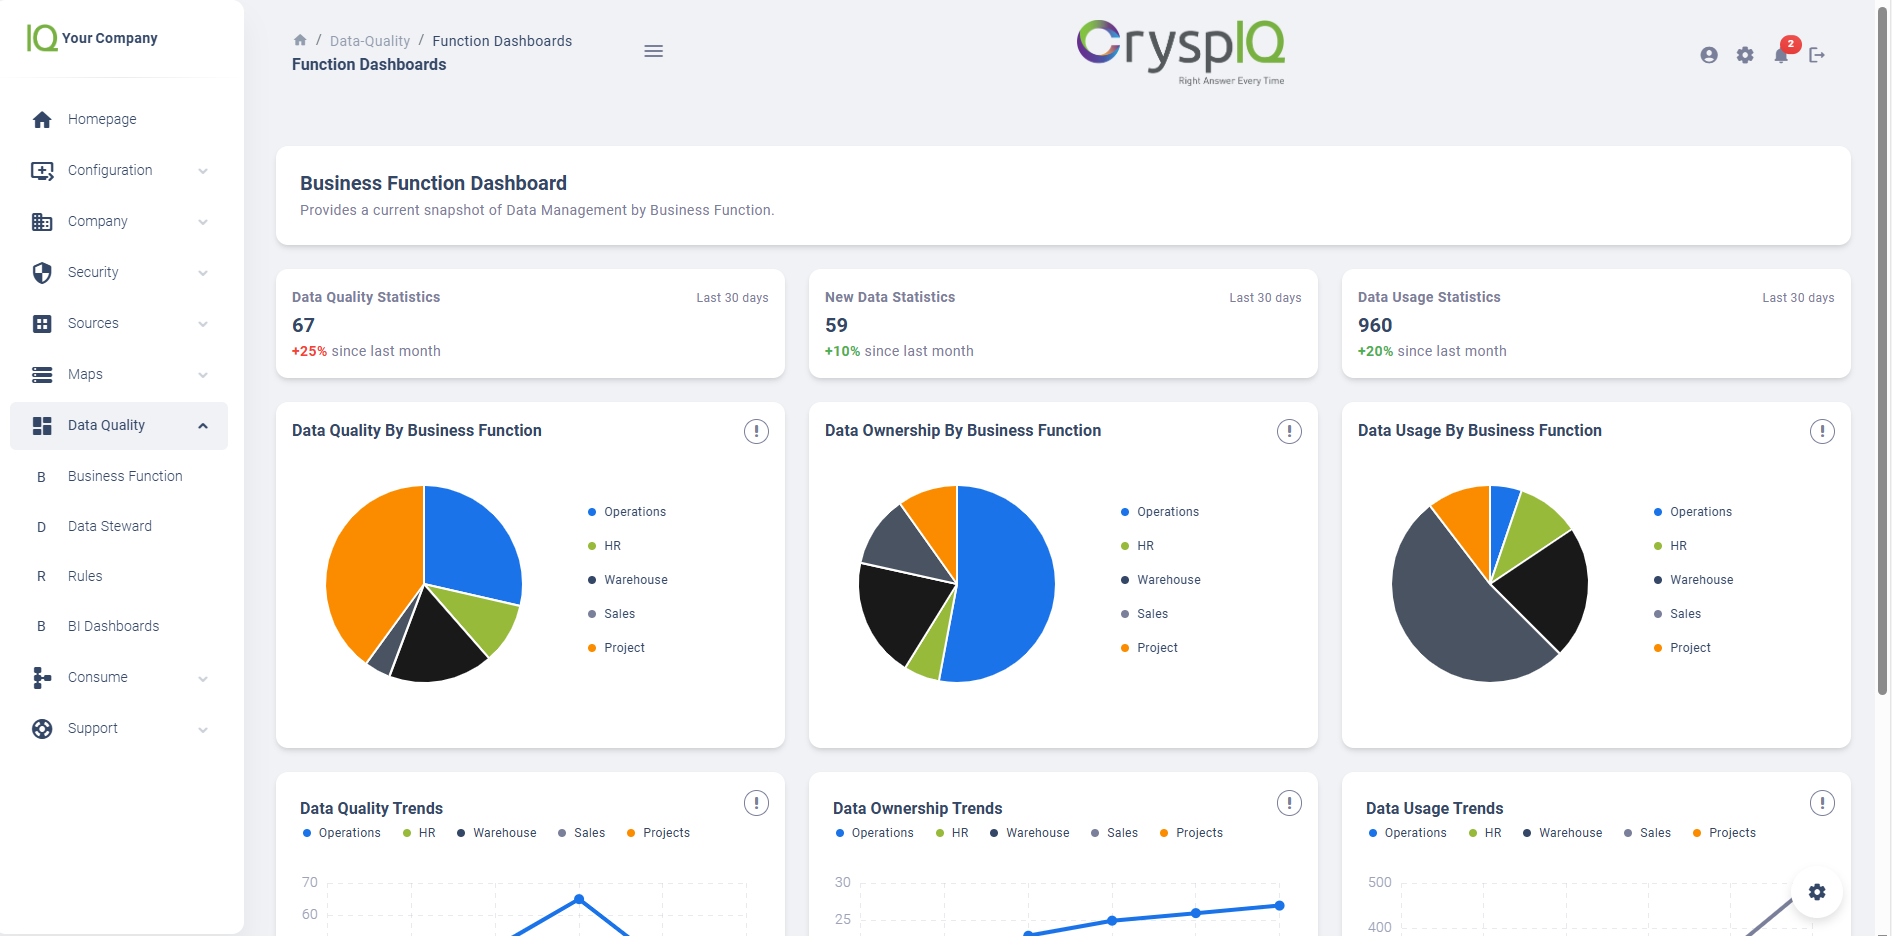
Business Functions
Business Functions are able to see at a glance how their Data is performing compared with the rest of the organisation. It will show them the summarised view of the Data Quality issues, Usage Statistics and their Contribution statistics. This helps the organisation drive accountability and performance to reach the optimised level of the organisation's confidence in Data being produced.
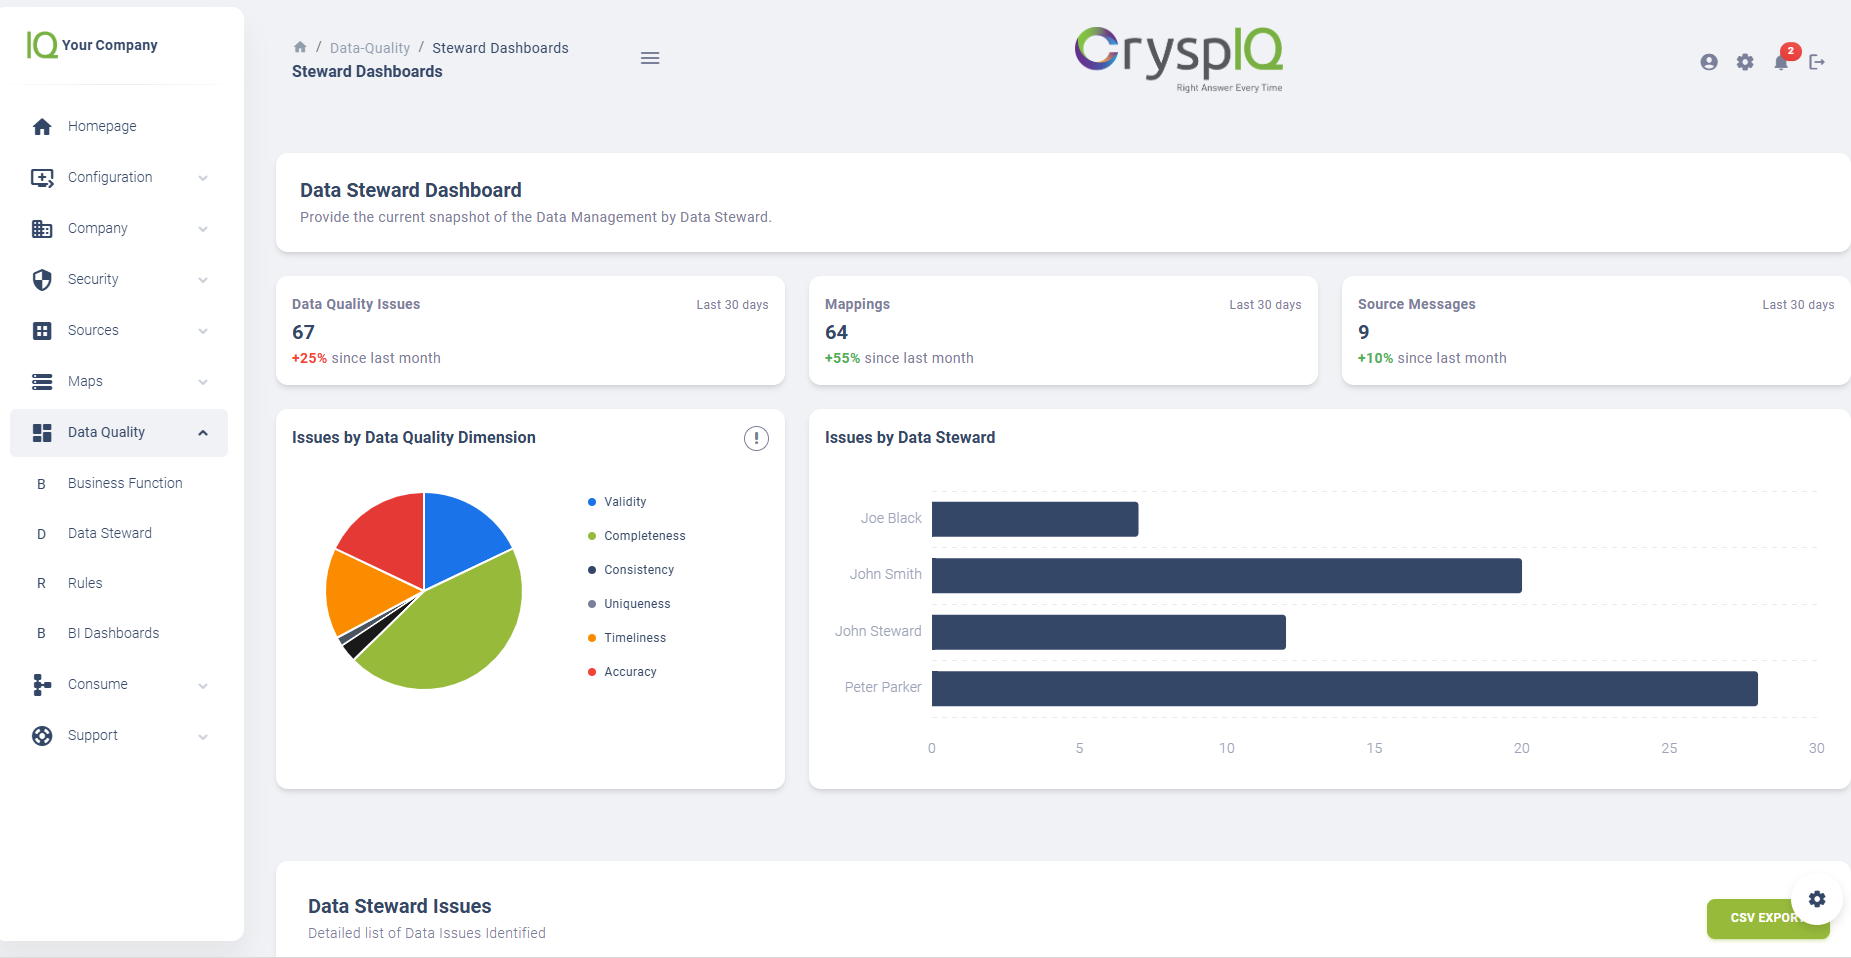
Data Stewards
Data Stewards can stay on top on their Data Quality issues which are tracked as the Data arrives into CryspIQ. This is live and continous process. Any records that do not conform with the Data Quality rules specified will be rejected and pushed back to the source for resolution. These rejections appear on the Dashboards and provide the specific detail required for the Data Steward to take the required action. Once resolved the updated record will pass into CryspIQ and the rejection will drop off the Dashboard.
Measures
Data Quality is measured in line with the six dimensions from DAMA Data Management Book of Knowledge, which are:
Accuracy
Data that attempts to model real-world objects or events.
Example:
- Incorrect spelling of a person's name
- Incorrect address for delivery
- Company ABN lookup check against ASIC records
Completeness
All required records and values should be available with no missing information. With completeness, the stored data is compared with the goal of being 100% complete.
Example:
- An address on a membership form. If three forms out of 100 are missing addresses, the data, regarding addresses, is 97% complete.
Consistency
This dimension is about a lack of difference when two or more data items are being compared. Items of data taken from multiple sources should not (in an ideal world) conflict with one another.
Example:
- A school’s database having a student’s date of birth showing the same format and value in both the school register and the documents sent from the school the student is transferring from.
Timeliness
The data’s actual arrival time is measured against the predicted, or desired, arrival time.
Example:
- A take away promises to deliver your food in 40 minutes, however the person taking the order only enters the Data into the system after the deliver was due, thus the KPI is not met.
Uniqueness
Data is properly identified and only recorded once. When data is unique, no record exists more than once within a database. Each record can be uniquely identified, with no redundant storage.
Example:
- A person should not appear more than once in a database becuase of a shortened version of their name. Thomas or Tom could be duplicate records of the same person.
Validity
Data closeness to pre-defined business rules or a calculation. When these rules are applied, the data falls within defined parameters or conforms to the syntax of its definition. Examples
- Based on Business Rules or Calculation
- Based on Validity for range of values
- Sequencing Order.
Example:
- Invoices order, receiving Invoice 1000 before Invoice 999 breaks the expected sequence.
- Personal Identity check using forms or Identification on file.
- Credit Card Number check - right number of Digits.